
By Everett Ballenger
Last month we looked at the various price brackets in which homes were selling (or not in some cases) in the five areas (Beaufort, Port Royal, Moss Oaks, Lady’s Island and Burton) which we monitor.
It was interesting but not surprising to see the difference in sales numbers the further up the price scale. This month I thought it might be of interest to look, by price bracket, at the number of homes sold in the last 12 months in the same five areas and using a single date in September, compare the inventory on that date and a similar date the previous year.
As to the question of inventory, based on the data in the chart, the number of houses available in the areas we monitor is decreasing between 10 percent and 13 percent every 12 months.
This decrease is primarily occurring in homes priced under $500,000. The number of homes in the over $500,000 price range is actually showing a slight increase. The number of overall sales occurring in the same area over the last 12 months has increased by almost 8 percent.
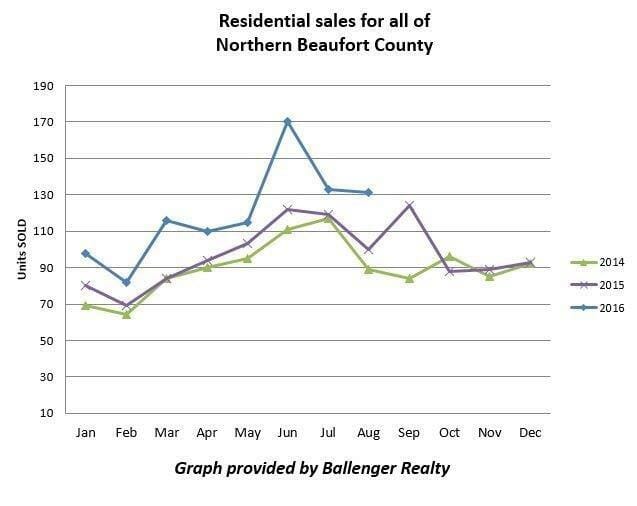
Readers of the LIBPA newsletter each month, and those who follow real estate in general, will know that sales have increased over the last two to three years. They are also familiar with the fact that following the real estate and financial collapse starting in 2006, homebuilders drastically reduced the number of new homes under construction.
So the increasing decline in the number of available homes for sale should not be a surprise.
There is a stark difference when comparing the time to sell a home in the $100,000 to $199,000 range (1.86 months) to homes over $1 million (58.53 months).
One would except property under $100,000 would sell the fastest, but that range took 1.96 months on average to sell. This slight increase may be due to the lack of inventory in the “up to $99,000.”
At 3.3 months, the $200,000 to $299,000 range is also a very short time frame.
The “normal” national inventory is around five months’ worth of homes for sale. Step up to the next price range of $300,000-$399,999 and we see a huge difference in monthly inventory (eight months’ worth). This increases the further up the price range we go, to the ($1 million and up) with 58.5 months of inventory available on Sept. 16.
This difference in monthly inventories should not be that surprising, as there are a lot less buyers the further up the scale we go.
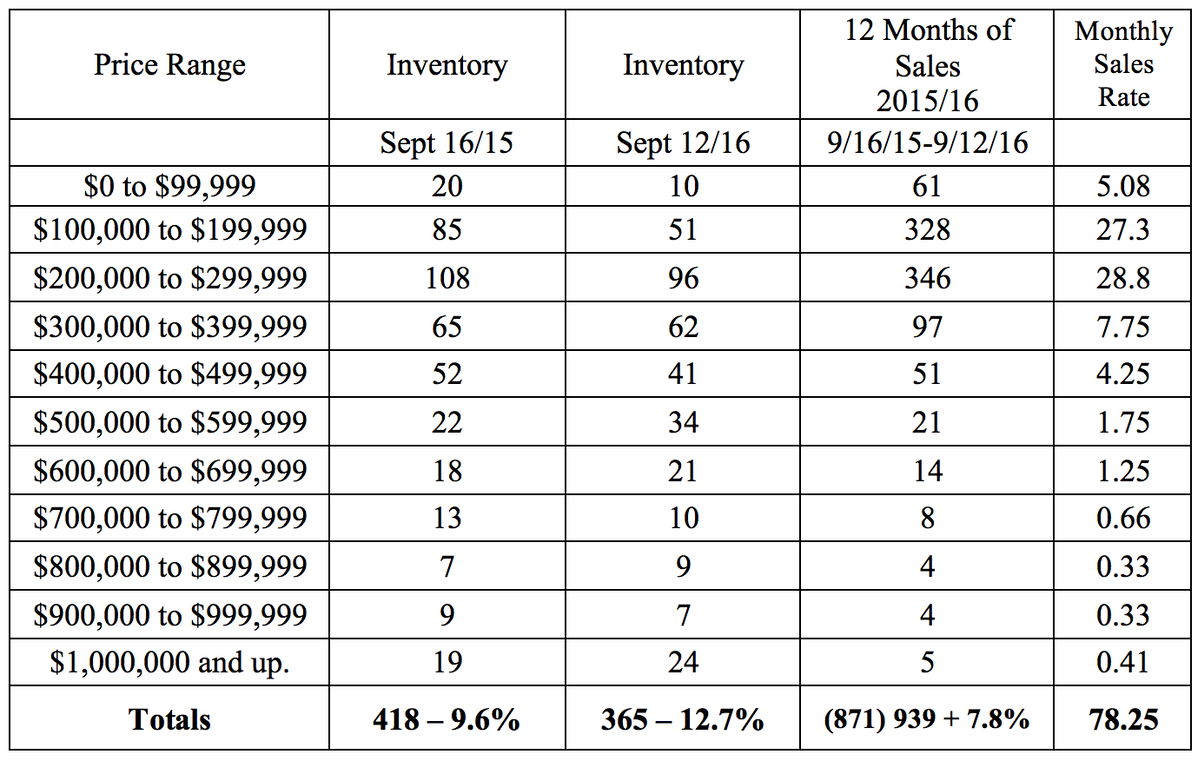
Finally, the question of where is the sweet spot in today’s local real estate market is best answered by the fact that 82 percent of all of the homes sold in the last 12 months in the five areas we monitor were in the $400,000 and under range.
When considering selling your home, please work with a Realtor to determine the best and most realistic price. Having the correct price can make all of the difference in the time the house will remain on the market.
Everett Ballenger is the owner of B.I.C Ballenger Realty and former president of Beaufort County Association of Realtors.